A List Apart: Articles: A More Accessible Map:
location based services
"As companies like Google and Yahoo! have simplified the process of placing information on a map by offering web services/APIs, the popularity and abundance of mapping applications on the web has increased dramatically. While these maps have had a positive effect on most users, what does it mean for people with accessibility needs?
Most online mapping applications do not address issues of web accessibility. For a visually impaired web user, these highly visual maps are essentially useless.
Is there a way to display text-based data on a map, keeping it accessible, useful and visually attractive? Yes: using an accessible CSS-based map in which the underlying map data is separated from the visual layout.
A different starting point
So what if, instead of starting from a map graphic and adding data to points located across the image, we start with the data itself and create a map based on the data?
First, let�s pick some data that has a geographic component so it can be placed on a map. For example, let�s use the 10 most populated cities in the world. Displayed as plain text, the list might look like this:
Tokyo, Japan � 28,025,000 people
Mexico City, Mexico � 18,131,000 people
Mumbai, India � 18,042,000 people
Sao Paulo, Brazil � 17,110,000 people
New York City, USA - 16,626,000 people
Shanghai, China � 14,173,000 people
Lagos, Nigeria � 13,488,000 people
Los Angeles, USA - 13,129,000 people
Calcutta, India � 12,900,000 people
Buenos Aires, Argentina � 12,431,000 people
Note: The data above is intended only as an example and may not be entirely accurate.
Not bad, but it would be nice to add some descriptive text to each of the cities to describe a little more abo"
skip to main |
skip to sidebar

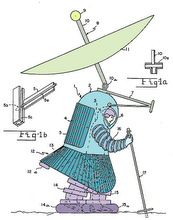
A Sextant --- solid brass navigation technology ... from 200 years ago !
The 2007 << Dream Machine >>
no doubts .. the ultimate smart phone in 2007

where it's at in 2007


... but it didn't catch on

... if you don't know where you've been - BUT - how did you GET here ?!?!
Our focus is on Location Based Services ( LBS ) which answer "Where am I? Where is it? How do I get there?" ... & Location Aware Devices (LADs) such as 3G smartphones, mobiles, cellfones, PDAs and personal wireless platforms. LADs will soon be everywhere [i.e. ubiquitous = DoCoMo]. This blog will stay on top of all things that will help us .... keep on track ... and show us where it's at
GPS SATNAV LBS "Personal Navigation Device"
A Sextant --- solid brass navigation technology ... from 200 years ago !
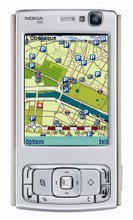
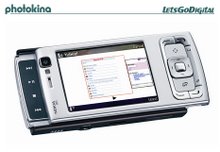
NOKIA N95
The 2007 << Dream Machine >>
OUR LOCAL TIME ( +10 hrs on Zulu)
Hobart |
NOKIA 95
no doubts .. the ultimate smart phone in 2007
SUBSCRIBE TO THE RSS FEED HERE


YOU'RE SEARCHING FOR WHAT
NOKIA N95
where it's at in 2007
The UBIKWITUS SWICKI
where do you come from ?
Blog Archive
-
▼
2006
(2445)
-
▼
April
(264)
- Location Based Services: "Location-based services ...
- Location Based Serviceslocation based servicesLoca...
- Location Based Serviceslocation based servicesLoca...
- N100location based services
- Communities Dominate Brands: What happens when maj...
- Feet up! : mobile/Too-Many-Models.html location ba...
- The Frustrations of Java at MobHappylocation based...
- InformationWeek | search engine optimization | Deb...
- Debate Breaks Out Over 'Tag Spam' | April 28, 2006...
- Google Condemned For Click-Fraud Settlement | Apr...
- No title
- Open Source GISlocation based servicesThis effort ...
- Global-i from Infomagnet - 3D globe full of world ...
- The Pondering Primate: Physical World Connection I...
- Xybernaut Sells Patents Targeting Ads To Mobile De...
- Google Offers Free 3D Modeling Software April 2...
- gps tracklog: Garmin GPSMAP 76CSx reviewlocation b...
- TomTom steers through another successful quarter -...
- Marketers Map Out Their GPS Ad PlansNEW YORK -- Ma...
- The View from Here - Articles: "The Mystery of Yah...
- The Mystery of Yahoo Maps Imagerylocation based se...
- MGeocoder: A Geocoding Google Maps API Extention:l...
- MGeocoder: A Geocoding Google Maps API Extention:l...
- MGeocoder: A Geocoding Google Maps API Extentionlo...
- Microvision (MVIS) Blog: Location-based Mixed Real...
- Navigating the Roadblocks to Consumer LBS Success ...
- Navigating the Roadblocks to Consumer LBS Success ...
- Nokia's latest mobile dazzle:location based servic...
- i-mode Business Strategy: What will change to make...
- dailywireless.org - Annapolis Free WiFi:location b...
- MobileCrunch � Baidu Chairman Li says �The Next Bi...
- MobileCrunch � Mobile Search Continues to Heat Up;...
- 'Huge opportunities' in mobile search, says Micros...
- Inrix and Curious Software Collborate | GPS Lodge....
- Pioneer Avic S1 Announced | GPS Lodge.comlocation ...
- GeoWeb 2006 - Everything is Connectedlocation base...
- "Neogeography" Blends Blogs With Online Mapslocati...
- Developers Like Google's Location-Based Tools Ap...
- Google Maps Mania: How Google Maps is used in News...
- Mapbender Gallery - MapbenderWikilocation based se...
- SRC Open Sources the Industry’s First Data and Cou...
- Google Maps Mania: Big News: Google Maps street ma...
- Main Page - MapbenderWikilocation based servicesMa...
- Smartspace - Smartspace - Wayfinder Interview: Jed...
- Social Networking SMS is Coming To TownopocketLook...
- LG LX350 Available On Sprint - Gizmodolocation bas...
- Nokia unveils latest mobile NseriesLOCATION BASED ...
- Marketers Map Out Their GPS Ad Planslocation based...
- The Daily ACK: Microsoft die, die, die!location ba...
- Report Examines Mobile Ad Prospectslocation based...
- US LBS market forecast to grow by 89 percent by en...
- A List Apart: Articles: A More Accessible Map:loca...
- Yellowpages to launch new mapping systemlocation b...
- Net Neutrality Debate Heats Up April 21, 2006loc...
- On Coordinate SystemsIf you feel like ending a con...
- Brian Flood : Google Earth Visualization Case Stud...
- Geocognosys Homelocation based servicesGeocognosys...
- A List Apart: Articles: A More Accessible Map:loca...
- Mobile phones gain on PCs for Internetlocation bas...
- gps tracklog: TomTom GO 910 review:location based ...
- gps tracklog: GPS for your car: Factory-installed ...
- null
- Dr. Vino's wine blog: New York City wine bars, a m...
- Official Google Blog: Back on the maplocation base...
- BT LAUNCHES LOCATION BASED SERVICES SOLUTION BT ...
- Google looks locally (Michael Sainsbury, APRIL 21,...
- Where2Talk Offers Mobile Phone Users Instant Commu...
- Mobile browsing becoming mainstream CNET News.com...
- MobileDataforce® and DeLorme Announce Integration ...
- TCS - Company Overviewlocation based servicesTeleC...
- Cellphone GPS services find their way into marketl...
- Lessons to be Learnt as 3G Reaches 40% Penetration...
- Navman Announces the Jupiter 30 Ultra High Sensiti...
- Earthcomber Equips Mobile Navigation for Smartphon...
- gps tracklog: TomTom GO 300 reviewlocation based s...
- Latest News, Traffic from your Zip Code- MIBAZAAR....
- Martin's Musings: Where in the World is Eva Longor...
- � Google Base begins to roll out the verticals We...
- NPR : Personal Maps Emerge as Visual Mix Tapesloca...
- � The intangible aspects of mashups matter most E...
- Google Maps API2 + Your Local Search Marketing Che...
- Travel Maps Growth As Local Search Heats Uplocatio...
- Making Money From Online Maps - Forbes.comlocation...
- TechCrunch � Comparing the Mapping Serviceslocatio...
- Online growth maps a future Media The Australian...
- Awareness of location based services is growing
- ThereArePlaces.com, the Leading Website for Intern...
- Mapdex: search geographic datalocation based services
- Home - User-friendly Desktop Internet GISlocation ...
- Opera Mini 2.0 coming later this month! - Opera Mo...
- Nokia examining AJAX | The Registerlocation based ...
- Satnav systems guide cars to a watery endlocation...
- N80 Nokia 3G Mobilelocation based services3G N80 :...
- MapQuest Launches New Mobile Offering location bas...
- LOC-AID technologies provides LOC-AID BSA to Tier ...
- EU presses for broadband's way forwardlocation bas...
- NAVTEQ Releases Voice Data for Netherlands locatio...
- iST iPointer System Selected As LBS Challenge Semi...
- Natural Area Coding System - NACS - Extended to Mo...
- Awareness of location based services is growingLoc...
- MobHappy: New Ideas in Location Based ServicesLoca...
- Navman Announces the Jupiter 30 Ultra High Sensiti...
- Navman Announces the Jupiter 30 Ultra High Sensiti...
- Mobile Browsing Seen Changing Face Of The Web Ap...
- Handmark Partnering with ViaMichelin to Distribute...
- Handmark Partnering with ViaMichelin to Distribute...
- Telenity’s Converged Location-Based Services Solut...
- exoSyphen Studios launches GSM-Tracker location ba...
- NEC America Reveals Its U.S. Network Operator WiMA...
- Ericsson Launches Smallest HSDPA / EDGE Mobile Pla...
- Amazon.com: Sony NV-U70 NAV-U GPS Portable Vehicle...
- Google Maps Mania: Australia Google Maps Mashup Ro...
- Routes and Maps Easily to Mobile Phone with Sonera...
- Handmark® Partners With ViaMichelin location based...
- GML - a Markup Language for Geographylocation base...
- How Far Is It? location based servicesCourtesy of ...
- Fastrax Announces New Versions of iSuite(tm) GPS S...
- KT Launches WiBro Commercial Triallocation based s...
- “Semapedia in Ghana”location based servicesThe sig...
- Advanced Information Technology Institute - Ghanai...
- Advanced Information Technology Institute - Ghanai...
- Photo2Search: Explore the Real World via Camera Ph...
- New Vehicles with XM NavTraffic Debut at The New Y...
- PORTMAN TO UNVEIL NEW GPS TRACKING PRODUCTS DURING...
- Report says wireless Web surfing on riselocation b...
- Free Association: Wireless Carriers Stifle Innovat...
- Mobile VGAlocation based servicesHeh. No sooner th...
- Location Based Services and Social NetworksWhere i...
-
▼
April
(264)
EARLY SATNAV ...
... but it didn't catch on
you don't know where you going...
... if you don't know where you've been - BUT - how did you GET here ?!?!

No comments:
Post a Comment